Bitcoin is currently trading in a tight consolidation pattern around the $104K mark, forming what appears to be a symmetrical triangle on the hourly chart within a larger descending triangle visible on longer-term time frames.
This compression of price action suggests that a significant move could be brewing, with the cryptocurrency testing the patience of both bulls and bears as it approaches the apex of the formation.
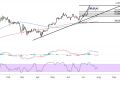
The symmetrical triangle pattern is characterized by converging trend lines, with the upper resistance line connecting recent highs around $108,000 and the lower support line linking successive higher lows. Price is currently hovering near the middle of this formation, indicating indecision in the market as participants await a decisive breakout.

Mixed Momentum Signs
The moving average configuration presents a cautiously optimistic Bitcoin outlook, with price action consolidating above key support levels. The recent price compression above the $103,414 support zone suggests that buyers are still defending lower levels, though the lack of strong upward momentum indicates some weakening in bullish conviction.
The stochastic oscillator appears to be cycling through neutral territory, reflecting the sideways price action and suggesting that neither buyers nor sellers have gained decisive control. This oscillator pattern is typical during consolidation phases, where momentum tends to flatten as the market searches for direction.
Meanwhile, the MACD histogram shows relatively muted signals, with the indicator lines converging near the zero level. This convergence often precedes significant moves, as the compression of momentum readings tends to build up energy for the eventual breakout direction. The histogram’s current positioning suggests that traders should watch for divergence signals that could hint at the next major move.
Bitcoin Breakout Scenarios
The immediate resistance level sits around $108,000, representing the upper boundary of the consolidation pattern. A decisive break above this level could trigger a rally toward previous highs, potentially targeting the $110,000-$112,000 zone where additional selling pressure might emerge.
On the downside, the key support level to monitor is around $103,414, which has provided a floor for recent price action. A breakdown below this support could signal a deeper correction, potentially targeting the $100,000 psychological level or lower support zones around $98,000-$99,000.
The current price positioning near $104,646 places Bitcoin at a critical juncture. Volume patterns during any breakout attempt will be crucial, as genuine breakouts typically require strong participation to sustain momentum beyond the triangle boundaries.
From a broader perspective, Bitcoin’s ability to maintain its consolidation above the $103,000 level demonstrates underlying strength, even as the market digests recent gains. However, the extended period of sideways movement suggests that a resolution to this pattern is becoming increasingly likely, making the next few trading sessions particularly important for determining Bitcoin’s medium-term direction.
Traders should prepare for increased volatility as the triangle pattern approaches its resolution point, with clear risk management strategies essential given the potential for sharp moves in either direction.


