Tron (TRX/USD) has broken decisively above the $0.29000 range resistance level that had capped advances for an extended period. Currently trading at $0.30157061, the cryptocurrency is consolidating just below this crucial breakout zone, setting up what could be a textbook retest scenario before the next phase of the rally unfolds.
The breakout from the prolonged horizontal resistance represents a significant shift in market dynamics, suggesting that the accumulation phase may be complete and a new trending phase is beginning. The manner in which Tron pierced through this solid ceiling indicates strong underlying demand and could signal the start of a more substantial upward movement.
Range Resistance Retest
The recent surge above the $0.29000 resistance level marks the completion of what appears to be a lengthy consolidation phase. This Tron breakout is particularly significant given the multiple failed attempts to breach this level in previous sessions, making the eventual success all the more meaningful from a technical perspective.
Current price action suggests that Tron may be preparing for a healthy pullback to retest the newly broken resistance as support. Such a retest would be entirely normal and healthy for the overall bullish structure, as it would allow the market to confirm the breakout’s validity while providing additional entry opportunities for momentum traders.

The Fibonacci retracement levels offer clear guidance on where this potential pullback might find support. The 38.2% retracement at $0.28904521 represents the first significant support level that could attract buying interest. This level coincides with previous consolidation areas and could serve as an ideal entry point for those who missed the initial breakout move.
Should selling pressure intensify, the 50% Fibonacci level at $0.28327345 would come into focus as the next logical support zone. This level often acts as a magnet for price action during corrective phases and could provide a more attractive risk-reward setup for aggressive buyers.
The 61.8% golden ratio at $0.27750169 represents a deeper correction scenario that would still preserve the overall bullish momentum while offering the most compelling entry opportunity.
Tron Technical Indicators
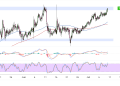
The moving average structure continues to provide a constructive backdrop for further upside momentum as the 100 SMA remains above the 200 SMA while possibly holding as dynamic support levels on a correction.
Momentum oscillators are displaying characteristics that support the continuation of the current Tron uptrend. The stochastic indicator shows signs of cooling from overbought levels, which is a natural development following the recent surge. This correction in momentum could facilitate the healthy pullback that would set up the next leg higher, particularly if the oscillator finds support above the 50 midpoint level.
The MACD histogram reveals encouraging underlying momentum, with the indicator maintaining positive readings despite the recent consolidation. While some momentum fatigue is evident, the overall structure suggests that the bullish Tron trend remains intact and could reassert itself following any corrective phase.


