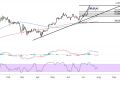
Bitcoin (BTC/USD) continues to hover above its ascending trend line support, breaking through multiple resistance levels to breach $109,550.
The cryptocurrency appears to be stuck at the $110,000 psychological level, with Fibonacci retracement levels providing key insights into potential price action ahead.
The chart reveals that Bitcoin has successfully maintained its longer-term uptrend, with the black ascending trend line continuing to act as dynamic support since the major low. A break below the short-term consolidation highlighted in blue could spur a correction to nearby Fibonacci retracement levels.
The Fibonacci retracement levels drawn from recent swing points show where bulls could step in again. The 38.2% retracement is at $108,544 near the rising trend line support while the 50% level is at $107,900 and the 61.8% level at is $107,253.

Mixed Bitcoin Picture
From a moving average perspective, both the 100 SMA (blue line) and 200 SMA (red line) remain well below current price action, confirming the bullish trend structure remains intact.
The significant gap between these key moving averages and current price levels indicates robust upside momentum, though it also suggests the market may be overextended in the near term.
Stochastic oscillator readings in the lower panel indicate the momentum indicator is approaching overbought territory, though it hasn’t reached extreme levels yet. This suggests there may be some room for additional upside before exhaustion sets in. However, traders should watch for any bearish divergence signals that could precede a correction.
Key Levels To Watch
The MACD histogram shows bullish momentum remains in place, with the signal lines maintaining their positive crossover. The green histogram bars indicate buying pressure continues to outweigh selling pressure, supporting the case for further gains. However, any weakening in the histogram could signal waning momentum.
Looking ahead, Bitcoin faces immediate resistance around the $110,000-$110,632 zone, which represents a significant psychological level and potential profit-taking area. A decisive break above this level could open the door for a test of previous all-time highs and potentially new record territory.
Conversely, any rejection from current levels could trigger a pullback toward the Fibonacci support cluster between $107,253-$108,544. The ascending trend line would provide the ultimate support test, and a break below this level would signal a more significant correction could be underway.
Bitcoin traders appear to be holding out for more developments on US-China trade talks, which have been a key driver of overall financial market sentiment so far this week. Optimism has kept risk assets like crypto elevated so far, although the lack of significant announcements after a couple of days of discussions are keeping market anxiety in play.
In addition, further developments on bitcoin regulation and institutional interest could sustain earlier rallies while setbacks could trigger profit-taking and deeper corrections on longer-term timeframes.


