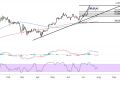
Bitcoin appears to be holding steady around the $101,159 level after experiencing a notable pullback from its recent highs near $109,024.
The cryptocurrency is currently testing a crucial support zone that coincides with multiple technical confluences, suggesting that the next directional move could be significant for medium-term price action.
The descending triangle resistance that has been capping upside momentum since the peak continues to exert downward pressure on price action. However, the recent stabilization around current levels indicates that buyers are stepping in to defend this area of interest.
The proximity to the psychological $100,000 level adds additional significance to this support zone, as round numbers often act as magnets for institutional and retail interest alike.

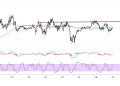
Fibonacci Retracement Levels
The Fibonacci retracement tool reveals several key levels that could influence Bitcoin’s next move. The current price action is hovering near the 38.2% retracement level at $102,211, which has provided some initial support.
Should selling pressure intensify, the next major area of interest lies at the 50% Fibonacci level around $103,512, near the broken triangle support at $103K, followed by the deeper 61.8% retracement at $104,812.
These Fibonacci levels are particularly noteworthy as they align with previous areas of consolidation, suggesting that institutional players may be positioning themselves at these technically significant zones. A sustained break above the 38.2% Fib could trigger a bullish reversal back toward the 50% level, while failure to hold current support might accelerate the correction toward the deeper retracement levels.
The 0% level at $98,000 represents the swing low and serves as a critical line in the sand for the bulls. A break below this level would likely trigger additional selling pressure and could signal a more substantial correction is underway.
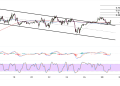
Mixed Bitcoin Cues
Moving average analysis reveals a nuanced picture for Bitcoin’s trend structure. While the longer-term uptrend remains intact, the recent price action suggests some near-term consolidation is likely. The descending trendline continues to act as dynamic resistance, keeping a lid on any aggressive upside attempts.
The stochastic oscillator appears to be emerging from oversold territory, which typically coincides with potential bounce opportunities. This divergence between price action and momentum could signal that selling pressure is beginning to wane. However, the oscillator still has room to climb before reaching overbought levels, suggesting any potential rally may have legs.
MACD momentum appears to be stabilizing after the recent decline, with the histogram showing signs of potential bottoming action. A bullish crossover in the MACD lines would provide additional confirmation that the correction may be nearing completion.
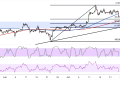
A decisive break above the descending trendline, accompanied by strong volume, could signal the resumption of the broader uptrend toward new highs. Conversely, failure to hold the $98,000 support could open the door for a deeper correction that tests lower support levels established during previous consolidation phases.
