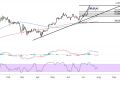
Bitcoin (BTC/USD) continues to hover above the $103,000 triangle bottom after establishing a series of lower highs since its peak earlier this year. The cryptocurrency is currently trading inside a descending triangle pattern, suggesting that a decisive bounce or breakdown could be imminent.
Price action shows Bitcoin trading around $104,985, as it gains some traction on the latest triangle support test. The descending trend line overhead continues to cap upside momentum, creating a compression pattern that typically precedes significant directional moves.
The moving average setup reveals a mixed but cautiously bullish scenario. The shorter-term moving average (red line) appears to be crossing above the longer-term average (blue line), which could signal emerging bullish momentum.
However, both indicators are still trading below the current price level, suggesting that Bitcoin needs to maintain current levels to confirm this potential bullish crossover.

Technical Momentum Indicators
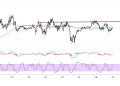
The stochastic oscillator in the lower panel is showing signs of turning higher from oversold territory, which typically indicates that selling pressure may be exhausting. The oscillator appears to be forming a base around the 20-30 level, suggesting that buyers could be preparing to jump in a cautiously bullish Bitcoin scenario.
Meanwhile, the MACD histogram shows recent bearish momentum has been waning, with the bars getting smaller in recent sessions. This divergence between price consolidation and weakening bearish momentum often precedes trend reversals, particularly when combined with oversold stochastic readings.
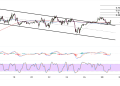
The volume profile indicates mixed participation, with recent sessions showing moderate activity that suggests neither buyers nor sellers have full control at current levels. This equilibrium state often resolves with sharp directional moves once a catalyst emerges.
Key Bitcoin Levels Ahead
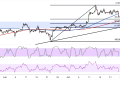
Failure to break above current resistance levels could see Bitcoin retest the $103,414 support zone. A breakdown from this level would likely trigger further selling toward the $102,000 psychological support, where the longer-term ascending trend line from earlier in the year could provide a more substantial floor.
The cryptocurrency market remains sensitive to regulatory developments and institutional adoption news, which could serve as the catalyst needed to resolve the current consolidation pattern. Given the technical setup, traders should watch for volume expansion on any directional break, as this would confirm the validity of the move and provide insight into the strength of the underlying trend.
With Bitcoin at a critical juncture between major support and resistance levels, the next few sessions could determine whether the cryptocurrency resumes its longer-term uptrend or faces a deeper correction toward more significant support zones.
Geopolitical tensions appear to be a major catalyst for broad financial markets, including crypto, as the possibility of full escalation between Iran and Israel could prompt US military engagement and further uncertainty. Bitcoin appears to be trading as a risk asset in the latest sessions, selling off on periods of increased market anxiety and rallying on relief scenarios.
