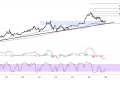
Binance Coin (BNB/USD) has formed a clean ascending triangle pattern, with the cryptocurrency currently trading at $663.85 as it approaches a critical test of the horizontal resistance at $665.
The technical formation showcases a series of higher lows connected by a rising support line, while sellers have consistently defended the $665 level, creating a coiling pattern that typically precedes significant directional moves.
The ascending triangle represents a classic bullish continuation pattern, characterized by the methodical accumulation evident in the rising lows that have elevated the support baseline from approximately $650 to current levels near $661.
The horizontal resistance at $665 has proven its significance through multiple rejection attempts, creating a well-defined ceiling that has contained previous rallies. However, the narrowing price range between this resistance and the ascending support suggests that the equilibrium between buyers and sellers is reaching a make-or-break point.

Binance Coin Breakout Scenario
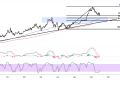
The ascending triangle’s structural characteristics strongly favor an upside resolution, with statistical analysis showing that approximately 70% of such formations break higher. The pattern’s measured move objective, calculated by adding the triangle’s height to the breakout point, projects a target near $670-$675 should Binance Coin successfully clear the $665 resistance zone with conviction.
The moving average structure reinforces the triangle’s bullish implications, with both the 100-period (blue) and 200-period (red) moving averages trending higher beneath the formation. The 100-period moving average at $659 has begun to converge with the ascending triangle’s support line, creating a powerful technical confluence that should provide robust support during any pre-breakout consolidation phases.
The proximity of the rising support line to the key moving averages creates an attractive risk-reward scenario for traders positioned ahead of the anticipated breakout. A decisive break above $665 would likely trigger algorithmic buying programs and potentially accelerate the advance toward the measured move target, while a failure to clear resistance would initially find support at the ascending trend line near $661.
Triangle Resistance Test
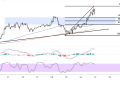
The momentum indicators are positioning themselves favorably for a potential breakout scenario, with both oscillators displaying characteristics that suggest building pressure beneath the triangle’s resistance. The stochastic oscillator is approaching the upper portion of its range without reaching extreme overbought conditions, indicating that buying momentum has room to expand during a potential resistance breakthrough.
The MACD histogram is showing subtle signs of momentum accumulation, with the signal lines maintaining a constructive configuration above the zero line. This positioning typically accompanies the final stages of triangle consolidation and often precedes the momentum expansion that drives breakout moves.
This compression of trading interest often precedes explosive moves as market participants position themselves for the anticipated resolution. A breakout above $665 accompanied by expanding volume would provide the strongest confirmation of the triangle’s bullish resolution and likely trigger sustained follow-through toward the pattern’s upside objective.

