
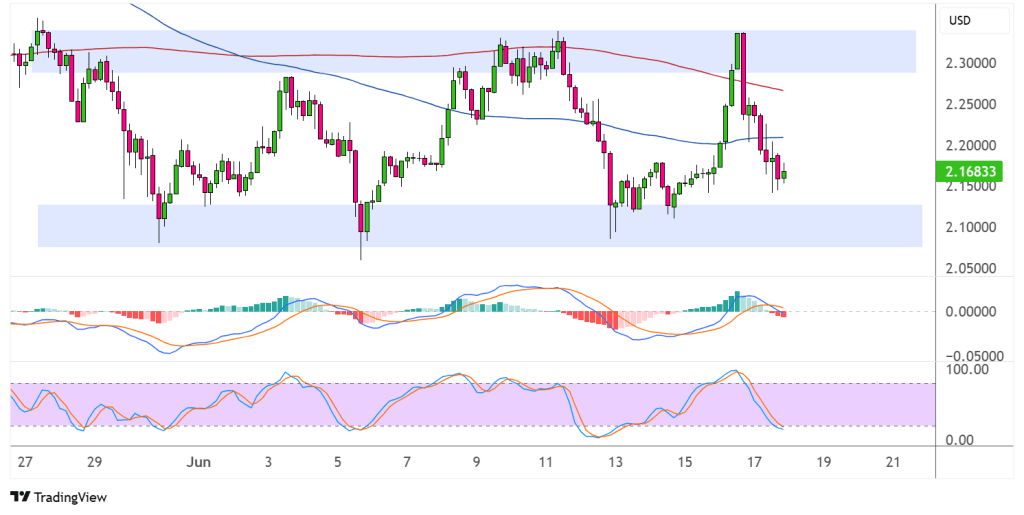
XRP has been trading within a well-established horizontal trading range over the past three weeks, with the cryptocurrency oscillating between strong support around $2.10 and resistance near $2.30.
This sideways consolidation pattern suggests that market participants are in a state of equilibrium, with neither buyers nor sellers able to gain decisive control over the price action. Currently trading at $2.16833, XRP sits closer to the lower end of its range, having recently bounced off the key support zone that has held firm during multiple tests throughout June.
The cryptocurrency’s ability to find buyers at these lower levels demonstrates underlying demand, while the repeated failures to break above the upper resistance zone indicate that supply pressures remain significant around the $2.30-$2.32 area.
The horizontal trading range pattern typically resolves with a breakout in either direction, with the magnitude of the eventual move often corresponding to the width of the consolidation zone. Given the approximately $0.22 range between support and resistance, a decisive breakout could potentially target $2.54 on the upside or $1.88 on the downside, depending on which level ultimately gives way first.
Sideways XRP Action
The moving average setup mirrors the sideways nature of XRP’s recent price action, with both the 100-period moving average and 200-period moving average trending horizontally through the middle of the trading range.


The convergence of both moving averages around the $2.20-$2.25 area creates a significant zone of dynamic support and resistance that price has been gravitating toward during the consolidation phase. The proximity of current price levels to these moving averages suggests that XRP remains in a state of technical neutrality, awaiting a catalyst to spark directional movement.
Should XRP break decisively above both moving averages with volume confirmation, it could signal that bullish momentum is building toward a test of the upper resistance zone. Conversely, a breakdown below these dynamic support levels might indicate that bears are gaining control.
Neutral Oscillator Conditions
The stochastic oscillator has been cycling through its full range during the consolidation period, currently positioned in neutral territory around the 50 level. This reading reflects the balanced nature of recent trading activity, with the oscillator’s inability to maintain extreme readings in either direction confirming the sideways price action that has characterized XRP’s recent performance.
The stochastic’s recent movement pattern shows regular cycles between oversold and overbought conditions, coinciding with XRP price bounces between the range support and resistance levels. This rhythmic oscillation suggests that the trading range remains intact, though any failure of the oscillator to reach previous extremes could signal that a breakout attempt is approaching.
The MACD indicator presents a slightly more constructive picture, with the signal lines hovering near the zero line and showing signs of potential bullish divergence. The MACD histogram has been printing smaller negative values during recent price dips to support, suggesting that downside momentum may be waning even as price remains range-bound.