Solana (SOL/USD) has broken decisively below its symmetrical triangle formation, confirming a bearish resolution that could trigger a measured move decline toward significantly lower price targets.
Currently trading at $179.74, the cryptocurrency has violated key technical support levels and appears positioned for further weakness as the breakdown gains momentum.
The triangle pattern that had been containing price action for several weeks has finally resolved to the downside, with the break occurring around the $180 level. This technical development typically signals that the period of consolidation has ended and that a new directional trend is beginning.
Given the bearish nature of this breakdown, Solana could be setting up for a prolonged decline that targets the triangle’s measured move projection.
Solana’s symmetrical triangle height suggests a potential downside target in the $170.31 area, which aligns with the 0.0% Fibonacci level and represents a significant support zone that bulls will need to defend. However, the clean break below the pattern’s lower boundary increases the probability that this level could be tested sooner rather than later.
What makes this technical setup particularly noteworthy for bears is how decisively price has moved away from the triangle’s support. The lack of immediate buying interest following the breakdown suggests that sellers are in firm control and that any bounce attempts may be met with renewed selling pressure.

Breakdown Retest Zones
The Fibonacci retracement tool applied to the recent range highlights several key levels that could influence Solana’s near-term price action. The 38.2% level at $180.15 now represents immediate resistance that could cap any relief rallies, while the 50% retracement at $185.19 has transformed from support to a more formidable resistance zone.
A potential retest of the broken triangle support around the 61.8% Fibonacci level at $186.23 would present a classic bearish scenario where previous support acts as new resistance. This area coincides with the triangle’s lower boundary, making it a logical target for any corrective bounce before the decline resumes.
Should Solana manage to stage a recovery attempt, failure to reclaim these Fibonacci levels would likely attract additional selling pressure from traders who missed the initial breakdown. This dynamic often creates a self-reinforcing cycle where each failed rally attempt brings in more bears, accelerating the downward momentum.
Solana Bearish Momentum
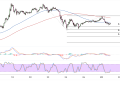
The moving average structure has shifted decisively bearish, with price now trading below both key dynamic support levels. The blue and red moving averages are beginning to slope downward, indicating that the intermediate-term trend has turned negative following the triangle breakdown.
MACD has rolled over and is trending lower, with the histogram bars showing increasing bearish momentum. This technical development supports the view that selling pressure is building and that the breakdown could extend further before any meaningful recovery attempt begins.
The stochastic oscillator has dropped into oversold territory but shows no signs of forming a bullish divergence that might suggest an imminent bounce. Instead, the indicator’s positioning suggests that bears remain in control and that any oversold rallies are likely to be short-lived and shallow in nature.


