Solana has been caught in an increasingly tight symmetrical triangle pattern over the past ten days, as the altcoin struggles to establish a clear directional bias following its retreat from recent highs near $205.
Currently trading at $181.77, SOL finds itself at the apex of this neutral consolidation formation, where converging trend lines are compressing price action toward what appears to be an imminent breakout or breakdown.
The symmetrical triangle is characterized by a series of lower highs and higher lows, creating two converging trend lines that meet at a focal point. The upper resistance line connects the declining peaks from the recent swing high, while the lower support boundary links the ascending troughs that have formed during this consolidation phase. This compression pattern typically indicates market indecision, with neither buyers nor sellers able to establish decisive control.
The current positioning near $182 places Solana dangerously close to the triangle’s apex, suggesting that a resolution may be imminent within the next few trading sessions as the pattern approaches its natural conclusion point.

Moving Average Convergence
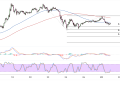
The moving average structure reflects the current state of Solana market equilibrium, with both the 100-period SMA (blue line) and 200-period SMA (red line) converging toward similar price levels around $187-$189. This convergence is typical during extended consolidation periods and indicates that short-term and long-term momentum have reached a balance point.
The 100 SMA has been declining steadily from its previous upward trajectory, while the 200 SMA continues its gradual ascent, creating a potential crossover scenario that could influence the triangle’s eventual resolution. The narrowing gap between these key technical indicators suggests that any breakout from the current pattern could trigger significant follow-through momentum in either direction.
Both moving averages are currently positioned above the current market price, providing a layer of overhead resistance that could complicate any upward breakout attempts. However, the flattening trajectory of both indicators suggests that they may offer less resistance than would typically be expected, particularly if accompanied by strong volume expansion.
Neutral Momentum Conditions
The stochastic indicator has been cycling between the neutral zone and oversold territory throughout the triangle formation, currently positioned near the 70 level after recovering from recent lows. This oscillation pattern is characteristic of range-bound markets and suggests that momentum extremes have been contained within the consolidation boundaries.
The recent bounce in stochastic readings from deeply oversold levels around 20 indicates that selling pressure may have reached temporary exhaustion. However, the oscillator’s position in the upper neutral zone also suggests limited upside momentum unless accompanied by a decisive break above triangle resistance.
The MACD histogram in the middle panel shows diminishing momentum in both directions, with the bars clustering closer to the zero line as the triangle pattern has developed. This convergence toward neutral territory is typical of symmetrical triangles and reflects the market’s inability to generate sustained directional momentum.
Solana’s triangle pattern resolution could trigger measured moves equivalent to the triangle’s initial height, potentially targeting $195-$200 on an upside break or $165-$170 on a downside violation.


