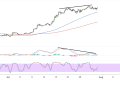
Ethereum (ETH/USD) has successfully broken above the upper boundary of its symmetrical triangle formation, with the cryptocurrency currently trading at $2,638.79 as it begins what appears to be a sustained move toward the next major resistance level.
The breakout above the triangle’s descending resistance line near $2,620 confirms that buyers have gained control, setting the stage for a potential rally to the $2,750 target zone.
The triangle breakout represents a significant shift in market dynamics, as the pattern measured from its widest point suggests an upside objective of approximately $250 from the breakout level. This technical projection aligns closely with the $2,750 resistance area, which represents a confluence of previous swing highs and psychological resistance.
Volume expansion during the breakout phase would serve as additional confirmation of the bullish momentum, though the initial thrust above resistance demonstrates that accumulation has been building throughout the consolidation period. The triangle’s completion after several days of sideways action suggests that this upward move could have substantial follow-through potential.

Moving Average Support
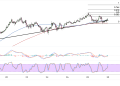
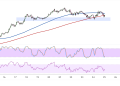
The moving average structure provides strong technical support for the ongoing breakout scenario. The 100-period moving average (blue line) at $2,580 has transitioned from resistance to support, creating a reliable floor for any potential pullbacks during the climb toward $2,750. This dynamic support level coincides with the broken triangle resistance, establishing a solid foundation for continued upward momentum.
The 200-period moving average (red line) positioned around $2,520 offers additional backstop support, though current price action suggests that Ethereum is unlikely to revisit these lower levels in the near term. The widening gap between the two moving averages indicates strengthening bullish momentum, with the positive crossover configuration supporting the breakout thesis.
Should Ethereum encounter profit-taking near current levels, any retracement toward the $2,580-$2,600 zone would likely attract renewed buying interest. The former triangle resistance now acting as support creates an attractive risk-reward setup for traders targeting the $2,750 objective.
Ethereum Upside Potential
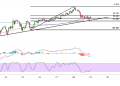
The momentum oscillators are beginning to reflect the breakout dynamics, with both indicators showing signs of bullish momentum acceleration. The stochastic oscillator has moved into the upper half of its range, suggesting that buyers are gaining strength without yet reaching overbought extremes. This positioning indicates room for further upside before momentum becomes stretched.
The MACD histogram is showing early signs of positive momentum expansion, with the signal lines beginning to diverge from the zero line. This development typically accompanies the early stages of trending moves and supports the view that the triangle breakout has genuine follow-through potential rather than representing a false breakout scenario.
From a measured move standpoint, the $2,750 target represents the minimum upside objective from the triangle breakout. A sustained break above this level could open the door for an extension toward the $2,850-$2,900 resistance zone, particularly if broader cryptocurrency market sentiment remains supportive.
