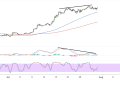
Ethereum has demonstrated resilience by staging a notable recovery above the $2,500 psychological level, currently trading at $2,501.59 after what appears to be a successful defense of key support zones.
The cryptocurrency’s ability to bounce from the recent lows and reclaim this important price threshold suggests that buyers are stepping in at critical junctures, potentially setting the stage for a more sustained upward move. This recovery comes after Ethereum tested lower support levels and found willing buyers, indicating that the recent selloff may have been overdone and creating opportunities for a technical rebound.
The bounce from the $2,200-$2,300 support zone has been particularly encouraging for bulls, as this area represented a confluence of prior resistance levels turned support and key Fibonacci retracement levels from the broader uptrend.
Ethereum’s ability to hold above $2,500 on this recovery attempt suggests that momentum may be shifting back in favor of the buyers, especially if the cryptocurrency can maintain its position above this level and begin to challenge higher resistance zones.

Bullish Ethereum Continuation
The moving average structure presents both challenges and opportunities for Ethereum’s recovery prospects. While the cryptocurrency remains below both the 100-period SMA around $2,600 and the 200-period SMA near $2,650, these levels now serve as clear upside targets for the current bounce.
The recent death cross formation, where the 100 SMA crossed below the 200 SMA, still represents a headwind for the bulls. However, if Ethereum can sustain its current recovery and push back above both moving averages, it would signal a potential reversal of the bearish momentum.
The area between $2,600-$2,650, where both moving averages converge, represents the key resistance zone that bulls must overcome to establish a more constructive technical outlook.
Early Signs Of Reversal
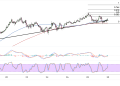
The technical oscillators are beginning to show encouraging signs for Ethereum’s possible bullish run. The stochastic indicator, while still in oversold territory, has started to curl higher from extremely depressed levels, suggesting that selling pressure may be exhausting. This oversold bounce setup often provides the foundation for more significant rallies, particularly when it occurs from well-established support levels.
The MACD indicator, though still bearish with the MACD line below the signal line, shows signs that the bearish momentum may be slowing. The histogram has begun to compress, indicating that the rate of decline is decreasing. A potential bullish crossover in the MACD would provide additional confirmation that the recovery has legs and could target higher resistance levels.
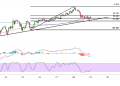
From a pattern perspective, Ethereum’s recovery above $2,500 could represent the completion of a successful retest of broken support, now acting as a foundation for higher prices. A break above $2,700 would likely trigger momentum buying and could propel Ethereum toward the $3,000 psychological level, representing a complete reversal of the recent correction and a resumption of the longer-term bullish trend.
