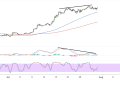
Ethereum has experienced a significant pullback from its recent peak around $2,885, currently trading near $2,481 as bears attempt to establish control following the breakdown from a key resistance zone.
The second-largest cryptocurrency appears to be finding temporary resistance around the 50% Fibonacci retracement level, as the overall technical picture suggests additional downside pressure could emerge.
The moving average configuration has shifted notably bearish, with price now trading below both the 100-period (blue) and 200-period (red) moving averages while the gap between the two starts to widen, reflecting strengthening selling pressure.
The 100 SMA is positioned around $2,550, acting as immediate resistance, while the 200 SMA near $2,580 provides additional overhead pressure close to the 50% Fib as well. This crossover pattern suggests that the path of least resistance has turned to the downside.

Returning Ethereum Weakness
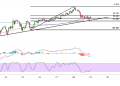
The MACD indicator has generated a clear bearish crossover, with both the MACD line and signal line residing in negative territory, further supporting the narrative for further Ethereum downside.
The histogram continues to print lower values, confirming that selling momentum remains intact. This divergence from the previous bullish momentum suggests that the recent Ethereum correction could extend further before finding a meaningful floor.
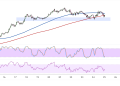
Stochastic readings are currently hovering near the oversold threshold around the 20 level, indicating that ETH may be approaching a short-term bounce opportunity. However, the oscillator has shown the ability to remain in oversold conditions during strong trending moves, so this alone may not be sufficient to halt the decline.
In addition, stochastic appears to be forming a bearish divergence with its lower highs compared to Ethereum’s higher highs, potentially attracting increased bearish pressure once the oscillator turns further south.
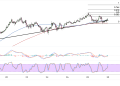
Key Fibonacci Levels
The Fibonacci retracement analysis reveals several critical levels that could influence near-term price action. A deeper correction could extend toward the 61.8% Fibonacci level at $2,590, which coincides with previous support-turned-resistance zones. This confluence of technical factors makes it a significant area to monitor for potential reversal signals.
The swing low at $2,112 represents the swing low from the previous correction and would likely act as major support if the current decline continues to accelerate. Such a move would constitute a substantial retracement of the recent advance and could signal a more significant shift in market sentiment.
Looking ahead, any Ethereum recovery attempt will need to reclaim the broken channel support and demonstrate the ability to close back above the moving average cluster around $2,550-$2,580. This move could hinge mostly on overall risk sentiment in the broader financial sector, as a pickup in risk-taking tends to benefit the crypto sector overall.
Until this occurs, the technical bias remains tilted toward additional downside pressure, with bulls likely waiting for clearer oversold conditions and positive divergence signals before attempting to establish new long positions.
