Ethereum has experienced a significant pullback from its recent highs around $2,889, but appears to be finding some stability near the crucial $2,112 support level.
The cryptocurrency has broken below a key area of interest around the $2,500 mark, and current price action suggests that sellers might be preparing to defend this key psychological level during the ongoing pullback.
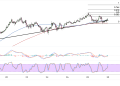
The recent decline has brought ETH/USD down to test the 0.0% Fibonacci retracement level at $2,112.80, which coincides with a major horizontal support zone. From this base, any recovery attempt would likely target the 38.2% Fibonacci retracement at $2,409.44 first, followed by the 50.0% level at $2,501.07.
A more substantial bounce could see Ethereum challenging the 61.8% Fibonacci level at $2,592.70, with the ultimate resistance target being the 100.0% retracement back at $2,889.34.
The descending trend line that has been capping upside moves remains intact, but the recent consolidation near current levels suggests that selling pressure may be diminishing. A decisive break above the $2,450 resistance zone, combined with a breach of the descending trend line, could signal that the correction phase is nearing completion.

Mixed Ethereum Signals
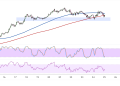
The moving average configuration presents a bearish Ethereum backdrop, with shorter-term averages positioned below their longer-term counterparts. However, the current price action near the $2,400 level shows Ethereum attempting to reclaim some of these dynamic resistance levels, which could be significant for near-term momentum.
The stochastic oscillator has recently moved out of oversold territory and is beginning to show signs of upward momentum, suggesting that the intense selling pressure from recent sessions may be easing. This shift in the stochastic could be an early indication that buyers are starting to step back into the market, particularly if the oscillator can sustain its move above the 20 level.
Meanwhile, the MACD remains in negative territory, but the histogram bars are showing signs of decreasing bearish momentum. The recent narrowing of the MACD lines suggests that the previous strong downtrend may be losing steam, and any bullish crossover would likely coincide with a more meaningful price recovery.
Ethereum Trading Outlook
The immediate focus remains on Ethereum’s ability to hold above the $2,112.80 support level, as a break below this floor could trigger additional selling toward the $2,000 psychological level. Conversely, a sustained move above $2,450 would likely attract momentum buyers and could propel ETH/USD toward the next resistance cluster around $2,500-$2,550.
Volume patterns will be crucial in determining the sustainability of any breakout attempt. Light volume on any upside moves would suggest that the rally lacks conviction, while heavy volume accompanying a break above key resistance levels would increase the probability of a more substantial recovery.
The ability of Ethereum to reclaim and hold above the 50.0% Fibonacci level at $2,501.07 would be particularly significant, as it would suggest that the bulls are regaining control of the medium-term trend.
