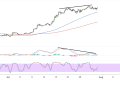
Ethereum (ETH/USD) continues to trade within a tightening symmetrical triangle formation, currently priced at $2,544.37 as the cryptocurrency approaches a critical decision point.
The triangle holding pattern just below the $2,600 major psychological barrier has been developing over the past several weeks, with converging trend lines creating a narrowing range that typically signals an impending breakout in either direction.
The triangle’s upper resistance line extends from the recent highs around $2,650, while the ascending support boundary originates from the July lows near $2,400.
This compression pattern reflects the ongoing equilibrium between buyers and sellers, with neither camp able to establish sustained dominance. The apex of the triangle appears to be approaching, suggesting that a significant price movement could materialize in the coming sessions.
The current consolidation phase has allowed Ethereum to digest recent gains while maintaining its structural integrity above key support levels. Volume patterns during this consolidation have been relatively subdued, which is typical for triangle formations as market participants await a decisive breakout to confirm the next directional bias.

Cautiously Bullish Picture
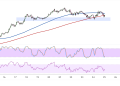
The relationship between the moving averages provides insight into the underlying Ethereum trend dynamics. The 100-period simple moving average (blue line) maintains its position above the 200-period SMA (red line), preserving the bullish crossover that has been intact throughout the recent uptrend. This configuration suggests that the intermediate-term trend remains constructive, despite the current sideways price action.
However, the gap between these two critical averages has contracted significantly compared to earlier phases of the uptrend, indicating that bullish momentum has moderated. Ethereum’s price has been oscillating around both moving averages, with the 100 SMA serving as dynamic support during recent dips while also acting as resistance during recovery attempts.
The convergence of price action around these moving averages reinforces the indecisive nature of the current market environment. A definitive break above the 100 SMA, accompanied by strong volume, would likely signal renewed bullish momentum and potentially trigger the upside resolution of the triangle pattern.
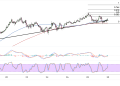
Ethereum Momentum Shifts
The stochastic oscillator, displayed in the lower panel, has been generating mixed signals throughout the consolidation period. Currently residing in neutral territory around the 50 level, the indicator suggests that momentum could swing in either direction depending on the triangle’s ultimate resolution.
Notably, the stochastic has formed a series of higher lows while price action has maintained relatively stable lows, creating a subtle bullish divergence pattern.
The MACD histogram shows diminishing bearish momentum, with recent bars displaying less negative pressure compared to the earlier stages of the consolidation. The MACD lines themselves appear to be converging near the zero line, suggesting that the current sideways movement may be nearing its conclusion.
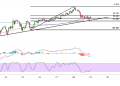
Should Ethereum break below the triangle’s lower boundary, the rising 200 SMA near $2,480 would represent the next logical support target. Conversely, a bullish breakout above the triangle’s upper resistance would target the measured move objective, potentially propelling Ethereum toward the $2,700-$2,750 range based on the triangle’s height.
