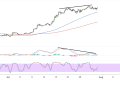
Ethereum has been showcasing impressive resilience over the past month, with the cryptocurrency establishing a well-defined trading range between the $2,400 support zone and resistance around the $2,800 level.
After reaching highs near $2,850 in mid-June, ETH has pulled back to current levels around $2,528, presenting what appears to be a healthy consolidation phase within the broader uptrend that has been in place since late May.
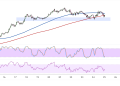
The recent price action suggests that Ethereum is building a solid foundation for the next leg higher, with the pullback from the June highs finding support near the middle of the established range.
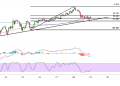
A successful defense of the $2,500 support area could pave the way for another test of the $2,800 resistance zone, with a break above potentially targeting the psychological $3,000 level. Conversely, a failure to hold current support might see Ethereum retreat toward the $2,400-$2,450 zone, where the 200-period moving average and previous breakout levels converge.

Moving Average Configuration
The moving average setup continues to favor the bulls, with the 100-period moving average (red line) maintaining a clear position above the 200-period moving average (blue line). This bullish crossover, which occurred in late May, has provided the foundation for Ethereum’s impressive rally from the $2,400 lows to the recent highs near $2,850.
More importantly, the gap between the two moving averages appears to be widening, suggesting that bullish momentum is strengthening rather than waning. Price action has been respecting the 100 SMA as dynamic support during the recent pullback, with several successful tests of this level providing confidence that the uptrend remains intact.
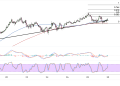
The ascending angle of both moving averages reinforces the positive Ethereum technical picture, indicating that the trend structure remains healthy despite the recent consolidation. Should price break decisively below the 100 SMA, it would represent the first significant crack in the bullish armor and potentially signal a deeper correction toward the 200 SMA around $2,450.
Potential Reversal Ahead
The stochastic oscillator has declined into oversold territory below the 20 level, a condition that typically precedes bounce attempts in trending markets. The oscillator appears to be forming a base in the oversold zone, which often coincides with exhaustion among sellers and renewed interest from buyers looking for attractive entry points.
This oversold reading takes on added significance given Ethereum’s position near key moving average support, as the combination of technical and momentum factors often produces reliable reversal signals. The stochastic’s proximity to extremely oversold levels suggests that any selling pressure may be nearing exhaustion.
The MACD indicator tells a similar story, with the histogram showing signs of potential bullish divergence as the recent price lows have not been confirmed by corresponding momentum lows. While the MACD lines remain below the zero line, reflecting the recent pullback, the narrowing of the negative histogram suggests that bearish momentum may be losing steam.
