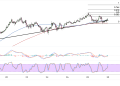
Ethereum (ETH/USD) is displaying concerning technical signals near current highs around $3,842, with bearish divergence patterns emerging across multiple oscillators that could signal an impending correction.
While the cryptocurrency has maintained its position above key moving averages, the failure to sustain momentum at these elevated levels suggests that the recent rally may be losing steam.
The most notable concern comes from the divergence between price action and underlying momentum indicators. As Ethereum has pushed to new short-term highs and continues to set sights on the key $4,000 barrier, both the stochastic and MACD oscillators have failed to confirm these advances with corresponding peaks.
This disconnect often serves as an early warning system for trend reversals, particularly when it occurs at significant resistance levels.

Mixed Technical Picture
The moving average configuration remains supportive in the near term, with Ethereum trading comfortably above both its shorter and longer-term moving averages. The blue and red trend lines continue to slope upward, indicating that the intermediate-term trend structure hasn’t been compromised despite recent warning signals.
However, the gap between these moving averages has begun to narrow, suggesting that bullish momentum is waning. Should Ethereum break below the ascending support trend line currently positioned around $3,600, it would likely trigger a test of these dynamic support levels.
The stochastic oscillator has spent considerable time in overbought territory above the 80 level, with recent readings showing signs of rolling over. This technical development, combined with the bearish divergence pattern, suggests that selling pressure could intensify if buyers fail to defend current support zones.
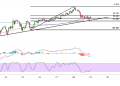
MACD presents a similar cautionary tale, with the histogram showing declining momentum bars despite price maintaining elevated levels. The signal line appears to be flattening, indicating that the strong bullish impulse that drove the rally from the $2,400 lows may be exhausting itself.
Nearby Support Zones
In the event of a correction from current levels, several Fibonacci retracement levels could provide meaningful support for Ethereum. The first significant level to watch would be the 38.2% retracement of the recent advance, which aligns with previous consolidation areas around $3,450.
A deeper pullback could target the 50% Fibonacci level near $3,150, which often serves as a crucial battleground during corrective phases. This zone also coincides with previous resistance that could now act as support, making it a logical area for buyers to re-emerge.
The most significant support level lies at the 61.8% Fibonacci retracement around $2,850, which would represent a substantial correction but still maintain the integrity of the longer-term uptrend. A break below this level could signal that the recent advance was merely a bear market rally rather than the beginning of a new bull phase.
Given the current technical setup, traders should remain cautious and consider reducing exposure near these highs until the bearish divergence either resolves through time or confirms through a meaningful price decline.
