Ethereum (ETH/USD) has demonstrated remarkable resilience throughout 2025, with the cryptocurrency currently trading around $3,643 and showing signs of building momentum for a potential assault on key resistance levels.
The weekly time frame reveals a compelling technical setup that suggests the second-largest cryptocurrency by market capitalization could be positioning for a significant breakout toward multi-year price targets.
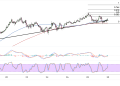
The digital asset has successfully navigated above both its 100-day and 200-day moving averages, with these key technical indicators now providing dynamic support for the ongoing recovery. This bullish crossover configuration has historically coincided with sustained upward moves in Ethereum, suggesting that the underlying trend structure remains favorable for continued gains.
Price action over the past year has carved out a broad consolidation pattern, with Ethereum establishing higher lows while testing overhead resistance zones. The cryptocurrency’s ability to maintain support above the $3,000 psychological level has been particularly encouraging, as this region has served as a crucial foundation for the current advance.

Long-Term Resistance Targets
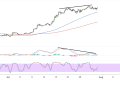
The weekly chart reveals two critical resistance levels that could determine Ethereum’s trajectory over the coming months. The first significant hurdle appears around the $4,000 level, marked by the lower horizontal resistance line that has capped previous rallies.
Should Ethereum successfully clear the initial resistance barrier, the next major target sits at the $4,862 level, as indicated by the upper horizontal line on the weekly timeframe. This represents the ultimate prize for bulls and would mark a return to levels not seen since the peak of the previous bull market cycle. The distance between these two key levels suggests that any breakout could result in substantial price appreciation.
The spacing between current levels and these targets indicates that Ethereum has significant room to run if momentum continues to build. Historical analysis shows that once major resistance levels are breached, the cryptocurrency tends to experience rapid price discovery phases as previously established resistance transforms into support.
Technical Indicators Align
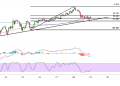
The stochastic oscillator on the weekly timeframe appears to be emerging from oversold conditions, suggesting that selling pressure has been exhausted and buyers are beginning to regain control. This technical development often precedes significant upward moves, particularly when combined with the current moving average configuration.
MACD momentum indicators show signs of positive divergence, with the histogram gradually improving even as price has remained relatively stable. This underlying strength suggests that accumulation may be taking place at current levels, setting the stage for a potential explosive move higher once resistance levels are challenged.
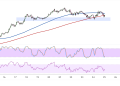
The broader market structure remains supportive of Ethereum’s technical outlook, with the cryptocurrency maintaining its position above key support levels while building the foundation for the next major advance.
Looking ahead, Ethereum’s path to the $4,000 target and higher appears increasingly viable as technical conditions continue to improve and market sentiment shifts toward a more constructive outlook for digital assets.
