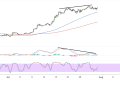
Ethereum has experienced a sharp decline from its recent highs near $2,577, currently trading around $2,234 as sellers maintain firm control over price action.
The cryptocurrency appears to be caught in a pronounced bearish trend, having broken below several key technical levels that previously provided support. The descending trendline resistance continues to cap any recovery attempts, suggesting that the path of least resistance remains firmly to the downside.
The recent price action has been characterized by consistent lower highs and lower lows, forming a classic bearish structure that has traders questioning whether this correction represents a temporary pullback or the beginning of a more substantial decline. The break below the psychological $2,400 level has opened the door for further downside, with price currently testing support around the $2,234 area.
The moving average configuration paints a bearish picture, with price action trading well below both the 100 and 200 period moving averages. The descending nature of these dynamic resistance levels suggests that any bounce attempts are likely to face significant overhead pressure, making sustained recovery rallies challenging in the near term.

Key Areas Of Interest
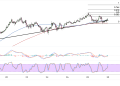
The Fibonacci retracement analysis reveals several critical levels that could determine Ethereum’s next directional move. Having already breached the 38.2% retracement at $2,290, the cryptocurrency is now testing deeper support levels. The 50% Fibonacci level at $2,349 has failed to provide meaningful support, confirming the strength of the current selling pressure.
The next major area of interest lies at the 61.8% retracement level around $2,400, which now serves as formidable resistance for any recovery attempts. This level coincides with previous consolidation zones and could attract renewed selling interest should price manage to rally back toward these levels.
The most concerning scenario for bulls would be a sustained break below the current support zone, which could accelerate the decline toward the 0% Fibonacci level at $2,112. This swing low represents the foundation of the previous rally and serves as a critical line in the sand for maintaining the longer-term bullish structure.
Continued Ethereum Weakness
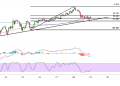
The stochastic oscillator reveals mixed signals, with readings hovering in the middle range rather than showing clear oversold conditions. This suggests that while some selling pressure may have been absorbed, there’s limited evidence of significant buying interest emerging at current levels.
MACD momentum continues to reflect bearish sentiment, with the histogram showing persistent negative readings. The lack of bullish divergence between price action and momentum indicators suggests that the underlying trend weakness remains intact. Any recovery attempts would need to be accompanied by improving momentum readings to gain credibility.
The technical picture suggests that Ethereum may need to establish a more convincing base before any sustainable recovery can take hold. A break above the descending trendline, coupled with reclaiming the 38.2% Fibonacci level, would be required to shift the near-term outlook from bearish to neutral.
