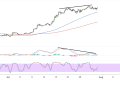
Ethereum (ETH/USD) continues to demonstrate resilience within its established uptrend, currently trading at $2,581.23 as it consolidates near multi-month highs.
The cryptocurrency appears to be in a healthy pullback phase after its impressive rally, with key Fibonacci retracement levels positioned to provide robust support that could fuel the next leg higher in this sustained bull market.
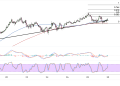
Fibonacci retracement analysis reveals a series of well-defined support zones that could serve as launching pads for Ethereum’s continued ascent. The 38.2% retracement level at $2,531.10 represents the most immediate support area, offering an attractive entry point for traders seeking to capitalize on any shallow correction within the broader uptrend.

Deeper Ethereum Correction
The 50% Fibonacci level at $2,499.72 stands as a more substantial support zone, coinciding with previous breakout levels that have transitioned from resistance to support. This mid-point retracement often attracts significant buying interest, as it represents an optimal risk-reward entry point for investors looking to participate in the ongoing uptrend without chasing prices at extended levels.
Should market dynamics require a deeper retracement, the 61.8% Fibonacci level at $2,468.37 presents the golden ratio support that frequently marks the maximum extent of corrections within robust uptrends. This level aligns with the ascending trend line structure, creating a confluence of technical factors that typically generates strong buying pressure and trend continuation signals.
The 100% retracement at $2,366.74 serves as the ultimate trend line support, representing the foundation of Ethereum’s current bullish structure. This level has consistently provided buyers with confidence throughout the recent advance and would likely attract institutional and retail interest should any correction extend to these depths.
Continued Upside Potential
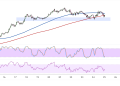
The stochastic oscillator’s current positioning suggests that Ethereum has successfully worked off overbought conditions without compromising its upward trajectory. The indicator’s movement away from extreme levels creates room for renewed buying pressure, indicating that the recent consolidation has been constructive rather than destructive to the overall trend.
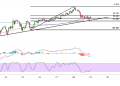
The MACD configuration continues to reflect the underlying strength of Ethereum’s uptrend, with the histogram showing that any momentum shifts remain within the context of a bullish framework. The interaction between the MACD line and signal line suggests that corrective phases are being met with renewed buying interest, supporting the case for trend continuation.
Moving averages maintain their upward slope, providing dynamic support that reinforces the static Fibonacci levels. The spacing between these indicators reflects healthy trending behavior, with each pullback to these dynamic support zones representing potential accumulation opportunities for astute investors.
The convergence of ascending trend line support, Fibonacci retracement levels, and bullish moving average alignment creates a technical environment where dips are likely to be bought aggressively. This setup suggests that Ethereum’s uptrend remains intact and that any near-term weakness should be viewed as a healthy correction within a larger bull market context.
