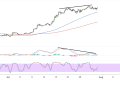
Ethereum appears to be finding solid footing at a crucial ascending trendline that has guided the cryptocurrency’s upward trajectory over recent weeks, with ETH/USD currently trading around $3,731 as buyers attempt to defend this key technical level.
The successful hold of this rising support could pave the way for another leg higher toward the Fibonacci extension targets and ultimately the psychological $4,000 resistance zone.
The ascending trendline has provided reliable support on multiple occasions, creating higher lows that have sustained the medium-term bullish structure. Each bounce from this upward-sloping line has resulted in renewed buying interest, suggesting that institutional and retail participants continue to view dips as attractive entry opportunities.
The current test of this support comes after a brief correction to the $3,600 support area from recent highs near $3,865. The Fibonacci extension tool reveals several key upside targets that could guide price action if the trendline support holds firm.
The immediate resistance sits at the 76.4% extension around $3,922, followed by the full 100% extension near $4,014. These levels represent natural profit-taking zones where sellers might emerge, but a sustained break above them could signal the beginning of a more aggressive rally phase toward the longer-term target zone near $4,000.

Renewed Bullish Momentum
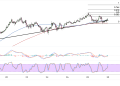
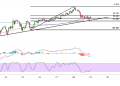
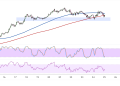
The moving average configuration continues to favor the bulls, with Ethereum trading comfortably above both key exponential moving averages. The shorter-term moving average is providing dynamic support just below the ascending trendline, creating a confluence of technical factors that could amplify any bounce from current levels. This alignment suggests that the underlying trend remains intact despite the recent pullback.
The gap between the moving averages has been widening throughout the recent advance, indicating strengthening bullish momentum. Should the trendline support fail to hold, the next logical support zone would likely emerge around the longer-term moving average, which currently sits several percentage points below the market price.
Potential Upside Recovery
The stochastic oscillator has retreated from overbought territory and is now approaching the midpoint level, suggesting that the recent selling pressure may be losing steam. This positioning provides room for the oscillator to climb higher without immediately entering extreme overbought conditions, potentially supporting another upward move if buying interest returns.
MACD momentum appears to be stabilizing after showing some bearish divergence near the recent highs. The histogram bars have contracted significantly, indicating that selling pressure is diminishing. A potential bullish crossover between the MACD lines could provide additional confirmation that buyers are regaining control of the near-term price action.
The combination of trendline support, favorable moving average positioning, and improving momentum indicators creates a compelling technical backdrop for Ethereum’s next potential advance. A decisive bounce from current levels could quickly target the Fibonacci extension zones, with the ultimate prize being a sustained break above the $4,000 psychological barrier that has long captured traders’ attention.
