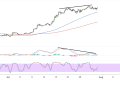
Ethereum (ETH/USD) has successfully completed an inverted head and shoulders reversal pattern, with the cryptocurrency breaking above the neckline resistance around $2,500 and now trading at $2,584.
This bullish reversal formation signals a potential end to the recent downtrend and suggests that significant upside momentum could be building as the pattern’s measured move target comes into focus.
The inverted head and shoulders pattern has been developing over the past several weeks, with the left shoulder forming around mid-June near $2,450, followed by the head at the $2,200 low in late June, and the right shoulder completing around early July at approximately $2,400.
The neckline connecting the highs between these formations has been decisively breached, confirming the validity of this classic bullish reversal pattern and clearing the path for a potential rally to the next ceiling around $2,900.

Bullish Reversal Confirmation
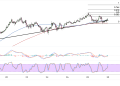
The break above the neckline resistance represents a crucial technical milestone, as it validates the inverted head and shoulders formation and activates the pattern’s upside potential. The neckline, which had acted as formidable resistance during multiple tests over the past month, has now been transformed into a support level that should provide a foundation for further Ethereum advances.
The measured move target for this inverted head and shoulders pattern points toward the $2,900 level, calculated by taking the distance from the head at $2,200 to the neckline at $2,500 and projecting it upward from the breakout point. This target represents approximately 12% upside from current levels and coincides with previous resistance zones that could provide natural profit-taking areas for pattern traders.
Current price action above the neckline shows conviction behind the breakout, with Ethereum establishing support above the former resistance zone. The cryptocurrency’s ability to hold above $2,500 following the initial breakout suggests that the pattern completion is genuine rather than a false signal, lending credibility to the bullish measured move scenario.
Technical Indicators Alignment
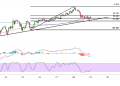
Moving average dynamics further support the reversal thesis, with the shorter-term average beginning to flatten and show signs of turning higher, while price action has successfully reclaimed both key moving averages. This technical development often accompanies major pattern completions and suggests that the underlying trend may be shifting from bearish to bullish.
The stochastic oscillator has turned decisively higher from deeply oversold conditions, reflecting the building bullish momentum that accompanied the neckline breakout. This momentum shift from extreme oversold readings often provides the fuel needed for sustained rallies, particularly when it coincides with major pattern completions like the current inverted head and shoulders formation.
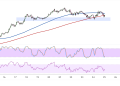
The MACD histogram is showing signs of positive momentum building, with the indicator beginning to compress toward a potential bullish crossover. This development typically follows successful pattern breakouts and suggests that the momentum behind Ethereum’s recovery is gaining strength rather than fading.
