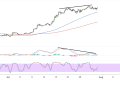
Ethereum (ETH/USD) is currently trading around $2,430.48, finding itself at a crucial juncture after experiencing significant selling pressure from recent highs near $2,750.
The second-largest cryptocurrency by market capitalization has broken below key technical levels, suggesting that bears may have gained control of the near-term price action as the digital asset searches for meaningful support.
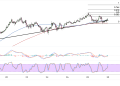
The recent decline has brought Ethereum to test several important Fibonacci retracement levels, with the current price action hovering just above the 38.2% extension at $2,186.13. This level represents the first significant support zone following the breakdown from higher levels, though the bearish momentum suggests that further downside could be in store if this floor fails to hold.
Should selling pressure intensify, the 50% Fibonacci level at $2,092.04 emerges as the next logical target, followed by the more substantial 61.8% retracement at $1,997.95. The major psychological $2,000 level coincides closely with this deeper Fibonacci support, potentially creating a confluence zone where buyers might step in to defend against further losses.
A break below these levels could open the door to a test of the 76.4% extension at $1,881.53, which would represent a significant correction from recent peaks.

Bearish Trend Shift
The moving average configuration has undergone a notable transformation, with the shorter-term averages beginning to roll over and potentially cross below longer-term counterparts. This technical development suggests that the path of least resistance may have shifted to the downside, marking a departure from the previously bullish structure that had supported Ethereum’s climb to higher levels.
Recent price action has seen Ethereum break below what appears to be a rising trend line that had been providing support throughout the earlier part of the year. This breakdown represents a significant technical development, as trend line violations often signal the beginning of more substantial corrective moves.
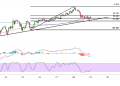
Stochastic readings have moved into oversold territory, indicating that selling pressure has been intense. However, the oscillator remains in the lower range, suggesting that bears still maintain control despite the oversold conditions. This technical setup often precedes further downside moves, particularly when momentum indicators fail to show immediate signs of recovery.
Bearish Ethereum Momentum
The MACD indicator appears to be displaying bearish characteristics, with the signal lines potentially moving into negative territory. This momentum shift reinforces the view that Ethereum’s recent decline may have more room to run, particularly if the histogram continues to show expanding bearish momentum.
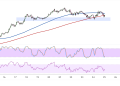
The current technical landscape suggests that Ethereum faces significant headwinds in the near term. Any recovery attempts are likely to encounter resistance at the broken support levels, which may now act as overhead supply zones. The $2,500 psychological level represents the first major hurdle for bulls, while a return above $2,600 would be needed to suggest that the recent selling pressure is beginning to subside.
