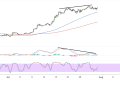
Ethereum is currently trading at $2,518, finding itself trapped within a well-defined descending triangle pattern that has dominated price action for several weeks.
The cryptocurrency appears to be approaching a critical juncture as the pattern nears its apex, with the convergence of support and resistance levels setting the stage for a potentially significant breakout in either direction.
The descending triangle formation is characterized by a series of lower highs connected by a downward-sloping resistance line, while horizontal support around the $2,500 level has provided a consistent floor for price action. This pattern typically resolves with a breakdown below support, though the compressed nature of the current price action suggests that volatility could spike dramatically once a decisive move occurs.

The descending resistance line has effectively capped multiple rally attempts, with each rejection reinforcing the bearish bias and contributing to the overall compression of the trading range. The most recent test of this resistance occurred around the $2,650-$2,700 area, where sellers emerged to push price back toward the triangle’s lower boundary.
Increasing Bearish Pressure
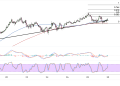
Price action is currently hovering just above the critical support zone, making this level particularly important for determining Ethereum’s near-term direction.
A decisive break below $2,491.19 could trigger a measured move lower, potentially targeting the $2,200-$2,300 area based on the triangle’s height. Conversely, a breakout above the descending resistance could signal a reversal of the bearish pattern and open the door for a rally toward the $2,800-$2,900 resistance zone.
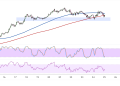
The moving average configuration continues to reinforce the bearish undertone that has characterized Ethereum’s recent price action. The 100-period moving average appears to be positioned around the $2,600 level, acting as dynamic resistance and coinciding with the descending triangle’s upper boundary. This confluence of technical factors makes any breakout attempt particularly challenging.
The 200-period moving average sits higher, creating an additional layer of resistance that would need to be overcome for any meaningful bullish reversal. The gap between these moving averages has been widening throughout the decline, indicating that bearish momentum has been building rather than dissipating.
Neutral To Bearish Bias
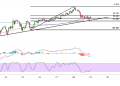
The stochastic oscillator has been cycling between neutral and oversold territory, reflecting the sideways grinding action within the Ethereum descending triangle. The oscillator’s current positioning suggests that while immediate selling pressure may be limited, there’s little evidence of building bullish momentum that could support a meaningful recovery.
The MACD histogram continues to hover near the zero line, indicating that momentum remains subdued as the triangle pattern matures. This compression in momentum often precedes significant moves, as the lack of directional conviction eventually gives way to a decisive breakout.
The convergence of the MACD lines near the zero level suggests that Ethereum is at an inflection point, with the next major move likely to be accompanied by a corresponding shift in momentum readings.
