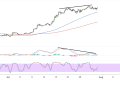
Ethereum (ETH/USD) has delivered an impressive breakout performance, surging to $2,797 after successfully clearing multiple resistance levels.
The world’s second-largest cryptocurrency appears to be in the midst of a powerful uptrend, having recently broken through the psychological $2,800 barrier and establishing fresh highs after a long period of consolidation.
The chart reveals a compelling bullish narrative, with Ethereum demonstrating strong momentum following a period of consolidation. The recent breakout represents a significant technical milestone, suggesting the bulls have gained firm control of price action. This breakout from previous resistance could now serve as a foundation for further upside exploration.

Sustained Upside Pressure
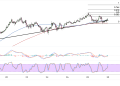
Price action shows Ethereum has successfully navigated above both key moving averages, with the 100 SMA (blue line) and 200 SMA (red line) providing dynamic support from below. The bullish crossover of these indicators earlier in the timeframe has been validated by the sustained rally, confirming the shift in underlying trend momentum.
The moving average configuration presents a bullish Ethereum narrative, with both the 100 SMA and 200 SMA trending higher and maintaining separation below current price levels. This alignment indicates the path of least resistance remains firmly to the upside, while any potential pullbacks should find support at these dynamic levels.
The Fibonacci retracement levels mapped from the recent swing provide crucial insight into potential correction zones. Should profit-taking emerge at current levels, the 38.2% retracements at $2,668.99 represents the first meaningful support area. Deeper corrections could test the 50% level at $2,613.57 or the 61.8% golden ratio at $2,558.16, both of which coincide with previous resistance areas that could flip to support.
The 100.0% Fibonacci level at $2,378.77 marks a more significant support zone that would likely attract substantial buying interest on any meaningful decline. This level represents the complete retracement of the recent rally and would serve as a critical line in the sand for the bullish thesis.
Mixed Ethereum Indicators
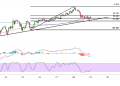
The MACD histogram in the middle panel shows bullish momentum remains intact, with the signal lines maintaining their positive crossover above the zero line. The green histogram bars indicate buying pressure continues to dominate, though the recent bars show some signs of momentum deceleration that bears monitoring.
Stochastic oscillator readings reveal a more cautionary picture, with both lines approaching the overbought territory above the 80 level. The oscillator has reached elevated levels that historically precede short-term corrections, suggesting buyers may need a breather before the next leg higher.
However, the blue stochastic line remains above the orange signal line, indicating bullish momentum hasn’t fully exhausted itself. A bearish crossover in overbought territory would provide the first warning sign that a pullback could be imminent.
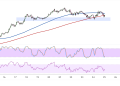
Looking ahead, Ethereum’s technical setup suggests the cryptocurrency is well-positioned for further gains, provided it can maintain support above the key Fibonacci levels. The combination of bullish moving average alignment, positive MACD signals, and breakout momentum supports the case for additional upside, though overbought stochastic readings warrant caution for new long positions at current levels.
