Dogecoin (DOGE/USD) is currently trading at $0.189, finding itself in a precarious position as it tests critical support levels following a substantial decline from recent highs above $0.20.
The meme cryptocurrency appears to be consolidating within a bearish channel, with price action struggling to maintain momentum above key Fibonacci retracement levels that could determine its near-term trajectory.
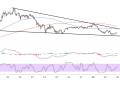
The recent price action shows Dogecoin forming lower highs since mid-May, with the moving averages acting as dynamic resistance levels. The cryptocurrency has been making a series of lower highs and lower lows, indicating that selling pressure continues to dominate the market structure despite occasional bounces from oversold conditions.
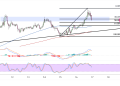
Dogecoin is hovering near the 38.2% Fibonacci extension level at $0.1733199, which could hold as near-term support. However, the failure to establish a convincing bounce from this level suggests that bears remain in control.

Below this lies the 50% extension at $0.1630774, followed by the more significant 61.8% Fibonacci level at $0.1528349, which could serve as the next major support zone if current levels fail to hold.
Continued Dogecoin Weakness
The moving average configuration paints a bearish picture for Dogecoin’s intermediate-term outlook. The shorter-term moving average (orange line) remains firmly below the longer-term average (blue line), confirming that the path of least resistance continues to point downward. This bearish crossover that occurred in mid-May has yet to show signs of reversal, suggesting that the downtrend remains intact.
Both moving averages are currently acting as dynamic resistance, positioned above the current price level around the $0.195-$0.200 region. Any attempts to rally toward these levels are likely to encounter significant selling pressure, as the averages coincide with the upper boundary of the descending channel.
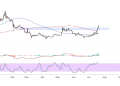
The MACD indicator in the middle panel continues to reflect the underlying weakness, with both the MACD line and signal line remaining in negative territory. While there have been occasional attempts at bullish divergence, the histogram shows that bearish momentum persists, albeit at a diminished pace compared to the initial decline.
Further Downside Risk
The stochastic oscillator reveals that Dogecoin has been cycling between oversold and neutral conditions, currently positioned in the lower half of its range. While the oscillator has bounced from deeply oversold levels below 20, it has struggled to establish sustained momentum above the 50 midline, indicating that buying interest remains tepid.
Recent stochastic readings show the oscillator attempting to turn higher from oversold territory, but the lack of follow-through suggests that any relief rallies may be short-lived.
Looking at potential scenarios, a break below the current Fibonacci support cluster could trigger accelerated selling toward the 76.4% retracement at $0.1401619, with the possibility of a full retracement to the 100% level at $0.1196769.
Conversely, for bulls to regain control, Dogecoin would need to reclaim the moving average resistance and break above the descending channel’s upper boundary. This scenario would require a decisive move above $0.21 with strong volume confirmation, potentially targeting a retest of recent highs.
