Dogecoin (DOGE/USD) is trading at a key area of interest at $0.1673850, with the meme cryptocurrency testing the crucial 61.8% Fibonacci retracement level that could serve as a springboard for a potential recovery within its broader ascending channel structure.
The digital asset has experienced a measured pullback from recent highs, but the overall ascending channel pattern remains intact, suggesting that the current correction may represent a healthy retracement rather than a trend reversal.
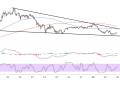
The ascending channel that has been guiding Dogecoin’s price action since late June continues to define the technical framework, with the upper boundary extending from the recent peak around $0.1765 and the lower support line connecting the rising lows from $0.1500. This channel structure remains valid despite the recent weakness, as price has yet to breach the lower boundary in a convincing manner.
The current pullback appears to be following a textbook retracement pattern within the ascending channel, with the 61.8% Fibonacci level at $0.1662605 emerging as the critical support zone. This golden ratio retracement level has historically served as a key inflection point for many financial instruments, often marking the maximum extent of corrective moves within established uptrends before buyers regain control.

Dogecoin Channel Dynamics
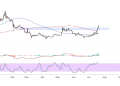
The ascending channel structure provides a compelling bullish framework for Dogecoin’s price action, with the recent decline representing a natural correction within the broader uptrend. The channel’s lower boundary, currently positioned around $0.1640, offers additional support below the current Fibonacci level, creating a robust foundation for potential buyers to establish positions.
The measured nature of the current pullback aligns with typical retracement behavior within ascending channels, where corrections often reach the 50% to 61.8% Fibonacci levels before resuming the primary trend.
Potential Target Levels
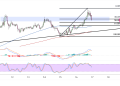
The channel’s width provides approximately 200-250 basis points of trading range, offering significant upside potential should the current support level hold. A successful bounce from the 61.8% Fibonacci level could target the channel’s midpoint around $0.1720, with further strength potentially driving price toward the upper boundary near $0.1765.
The proximity of the current price to this key Fibonacci level suggests that the correction may be approaching its natural conclusion. Historical analysis of similar setups indicates that successful defenses of the 61.8% retracement level often lead to sharp rebounds, as short-term bears rush to cover positions while fresh buyers emerge.
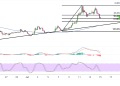
The stochastic oscillator’s descent into oversold territory reinforces the potential for a bounce from current levels, with the indicator showing readings below 20 that historically coincide with short-term bottoms. The MACD histogram, while still displaying bearish momentum, shows signs of deceleration that could signal an impending momentum shift.
A decisive bounce from the 61.8% Fibonacci level would likely trigger a relief rally back toward the 38.2% retracement at $0.1701753, with sustained strength potentially driving Dogecoin back to challenge the ascending channel’s upper boundary and recent highs above $0.1750.
