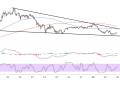
Dogecoin is currently trading at $0.167, finding itself in a critical consolidation phase after experiencing a significant decline from higher levels.
The cryptocurrency has stabilized near the 38.2% Fibonacci retracement level near the $0.17 mark, which appears to be providing temporary resistance following the pullback from the channel bottom bounce.
The Fibonacci retracement tool indicates that the 38.2% Fibonacci level has historically been a significant area where corrections often find their footing, making this current consolidation particularly noteworthy for determining the next directional move.
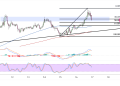
Should the current resistance fail to hold, the next major Fibonacci level to watch is the 50% retracement at $0.1724937, followed by the deeper 61.8% level at $0.1746643. These levels represent potential areas where sellers could step in to defend against further rallies, though a break below the 38.2% level would indicate that the downtrend is gaining traction.
The descending channel pattern that dominated the earlier decline appears to have given way to sideways consolidation, indicating that the immediate selling pressure may be diminishing. However, the overall Dogecoin technical structure remains cautious, with price still trading below key moving averages and facing overhead resistance from the broken support levels.

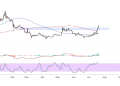
Moving Average Configuration
The moving average setup presents a nuanced picture for Dogecoin’s near-term prospects. While price remains below both the 100 and 200-period moving averages, the recent consolidation has allowed these indicators to begin flattening out, suggesting that the momentum of the decline may be waning.
The 100 SMA appears to be positioned around the $0.1750000 level, creating a zone of dynamic resistance that coincides with the deeper Fibonacci retracement levels. This confluence of technical factors makes any move above this area particularly significant, as it could signal a shift in the underlying trend structure.
The 200 SMA continues to slope downward but at a decreasing rate, indicating that while the longer-term bias remains bearish, the intensity of the selling pressure has moderated. A successful reclaim of both moving averages would be required to suggest that Dogecoin is ready to mount a more meaningful recovery attempt.
The gap between the moving averages has been narrowing during the consolidation phase, which often precedes either a continuation of the prevailing trend or a reversal. Traders should monitor for potential bullish or bearish crossovers that could provide directional clarity.
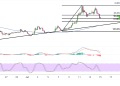
Potential Dogecoin Stabilization
The stochastic oscillator has been cycling through neutral to slightly oversold territory, indicating that the selling momentum that characterized the earlier Dogecoin decline has largely dissipated.
The oscillator’s current positioning suggests that Dogecoin may be finding its footing at current levels, though a decisive move above the midpoint would be needed to confirm improving momentum.
The MACD histogram shows signs of potential stabilization, with the recent compression in the indicator suggesting that bearish momentum is losing steam. While the MACD lines remain below the zero level, the narrowing between them indicates that the rate of decline has slowed considerably.
