Cardano (ADA/USD) has completed a textbook head and shoulders reversal pattern, with price breaking decisively below the neckline support and currently trading at $0.7729.
This bearish pattern completion typically signals a significant trend reversal and projects a measured move decline that could take the cryptocurrency substantially lower in the coming sessions.
The head and shoulders formation that developed over recent weeks shows a clear peak around $0.8572, flanked by two lower shoulders that failed to challenge the central high. The pattern’s neckline, which connected the lows between these formations, has been violated with conviction, confirming the bearish reversal signal and opening the door for extended weakness.
Based on the pattern’s height, the measured move target points toward the $0.7333 area, representing the 0.0% Fibonacci level and a significant technical support zone. This projection aligns with previous consolidation areas and could serve as the initial downside objective for this breakdown move.
The manner of the breakdown suggests that selling pressure has intensified, with price moving decisively away from the neckline without any meaningful bounce attempts.

Key Resistance Zones
The Fibonacci retracement tool applied to the recent Cardano decline reveals several critical levels that could now act as resistance during any corrective bounces. The 38.2% retracement at $0.7807 represents the first significant hurdle that bulls would need to overcome to suggest that the selling pressure is abating.
More formidable resistance lies at the 50% Fibonacci level around $0.7853, which coincides roughly with the broken neckline area. This zone represents a classic scenario where previous support transforms into new resistance, often attracting fresh selling interest from traders who recognize the technical significance of the level.
The 61.8% retracement at $0.8099 would likely prove to be a major resistance zone should Cardano manage to stage any meaningful recovery attempt. This golden ratio level often caps corrective bounces in trending markets and could serve as an ideal location for bears to re-establish short positions.
Any rally that approaches these Fibonacci levels without showing strong momentum characteristics would likely be viewed as a selling opportunity, particularly given the clear bearish signal provided by the head and shoulders pattern completion.
Bearish Cardano Outlook
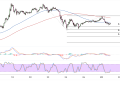
The moving average structure has turned decisively bearish, with Cardano now trading below both key dynamic support levels. The blue and red moving averages are beginning to flatten and roll over, indicating that the intermediate-term trend has shifted from bullish to bearish following the pattern breakdown.
MACD has crossed below its signal line and is trending lower, with the histogram bars showing increasing negative momentum. This technical development confirms that selling pressure is building and supports the view that the head and shoulders breakdown could lead to an extended decline phase.
The stochastic oscillator has dropped from overbought levels and is now approaching the lower end of its range. While this positioning suggests that Cardano may be becoming oversold in the near term, the lack of any bullish divergence patterns means that any bounce is likely to be temporary and corrective in nature.


