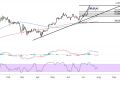
Bitcoin (BTC/USD) is currently trading near the $107,653 level, hovering just below a significant descending trend line that has been capping upside momentum since earlier in the year.
The cryptocurrency appears to be setting up for further consolidation, with price action consolidating above the crucial $103,024 support zone that has proven resilient during recent pullbacks.
The descending trend line of the triangle pattern represents the primary obstacle for bulls, as a decisive break above this resistance could trigger a substantial rally toward the $110,000 psychological level and beyond.
However, the inability to sustain momentum above this technical barrier suggests that sellers remain active at higher levels, creating a tug-of-war between competing forces.

Moving Average Dynamics
The moving average configuration paints a constructive picture for Bitcoin’s medium-term outlook. The 100-period simple moving average (blue line) has crossed above the 200-period SMA (red line), forming a golden cross that typically signals the resumption of bullish momentum.
This positive crossover suggests that the path of least resistance remains to the upside, even as price encounters resistance at the descending trend line.
Currently, both moving averages are providing dynamic support around the $105,000-$106,000 zone, with price trading comfortably above these key technical levels. The widening gap between the two indicators reflects strengthening bullish pressure, although the recent consolidation phase has caused some flattening in the momentum indicators.
Bitcoin Technical Oscillators
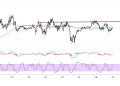
The stochastic oscillator in the lower panel indicates that Bitcoin has recently emerged from oversold territory and is trending higher, suggesting that selling pressure has been exhausted in the near term. However, the oscillator has yet to reach overbought levels, indicating there may be room for additional upside momentum before encountering resistance from profit-taking activities.
The MACD histogram shows signs of bullish divergence, with the momentum indicator forming higher lows while price action has been consolidating. This divergence pattern often precedes significant breakout moves, as it suggests that underlying momentum is building despite sideways price movement.
From a fundamental perspective, Bitcoin continues to benefit from institutional adoption and growing acceptance as a store of value asset. The recent consolidation around current levels could be viewed as healthy price discovery ahead of the next major move, with the cryptocurrency potentially setting the stage for a test of new all-time highs above $110,000 if bulls can successfully clear the descending trend line resistance.
Shifting market sentiment, however, has proven to be pretty complex for the cryptocurrency sector. Bitcoin appears to be acting as a “safe-haven” digital gold in times of risk aversion while often serving as a proxy for risk assets like US tech sector shares during healthy market rallies. Geopolitical tensions have been front and center so far this week, with easing tensions triggering some profit-taking off safe-haven assets like gold.
