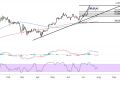
Bitcoin is currently trading around $107,134, hovering near a critical resistance zone that has been tested multiple times over recent weeks.
The cryptocurrency appears to be forming a consolidation pattern after its impressive rally from the mid-$97,000 support level, with price action suggesting that a decisive breakout could be imminent in either direction.
The chart reveals a descending channel resistance that had been capping upside moves since the peak around $110,000 but appears to have been broken earlier this week. Meanwhile, an ascending support trend line (in red) has been providing a floor for the recent price action, creating a converging triangle pattern that typically resolves with a significant directional move.
Price is currently testing the upper boundary of this consolidation range, with the 100-period moving average (blue line) providing dynamic support around the $105,500 level. The 200-period moving average remains below current price levels, confirming the longer-term bullish bias despite the recent sideways action.

Technical Indicator Analysis
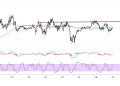
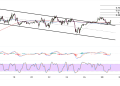
The momentum oscillators are painting a mixed picture at current levels. The MACD histogram shows diminishing bullish momentum, with the signal lines converging near the zero line. This suggests that the previous uptrend may be losing steam, though it hasn’t yet confirmed a bearish reversal.
The Stochastic oscillator is positioned in neutral territory around the 50 level, indicating neither overbought nor oversold conditions. This positioning allows for movement in either direction, with the oscillator having room to climb toward overbought levels if bulls regain control, or decline toward oversold territory if selling pressure intensifies.
Stochastic is making lower highs, however, while Bitcoin price saw higher highs. This is indicative of bearish divergence that could attract increased selling pressure and potentially drag price back inside the downtrend channel.
Bitcoin Price Projections
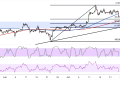
The immediate resistance zone lies between $108,000 and $110,000, where the descending trend line intersects with previous swing highs. A convincing break above this area could target the previous all-time highs and potentially establish new record levels for Bitcoin.
On the downside, the ascending trend line support around $105,000-$106,000 represents the first line of defense for bulls. Should this level fail to hold, the next significant support zone emerges around $102,500, coinciding with the 200-period moving average.
From a broader perspective, Bitcoin’s price structure remains constructive as long as it maintains above the key $100,000 psychological level. The cryptocurrency continues to benefit from institutional adoption narratives and favorable regulatory developments, though near-term price action will likely depend on technical factors and broader market sentiment.
A breakout above the descending trend line resistance could signal the resumption of the longer-term uptrend, while a breakdown below the ascending support might indicate a period of deeper consolidation or correction before the next major advance. Overall risk sentiment prevailing in the broader financial markets could be key in determining near-term Bitcoin direction.
