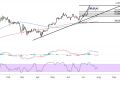
Bitcoin (BTC/USD) has been trading within a tightening triangle consolidation pattern over the past several weeks, with price action converging toward an apex that suggests a significant move could be imminent.
The cryptocurrency is currently hovering around the $108,909 level, trapped between descending resistance and ascending support lines that have been guiding price action since early June.
The triangle formation spans from approximately $110,000 at the upper boundary resistance down to around $105,000 at the lower edge, creating a narrowing range that typically precedes substantial volatility. This technical setup indicates that market participants are in a state of indecision, with neither bulls nor bears able to establish clear dominance in the near term.

Bitcoin Trend Analysis
The moving average configuration presents a mixed but cautiously optimistic picture for Bitcoin’s medium-term outlook.
The 100-period moving average (blue line) appears to be providing dynamic support around the $106,000-$107,000 zone, while the 200-period moving average (red line) is positioned slightly lower near $105,500. This arrangement suggests that the longer-term uptrend structure remains intact despite the recent consolidation phase.
The proximity of these key moving averages to current price levels creates a critical decision point. A decisive break above the triangle’s upper resistance at $110K, combined with sustained trading above both moving averages, would likely trigger renewed buying interest and potentially propel Bitcoin toward the $112,000-$115,000 resistance zone.
Conversely, a breakdown below the ascending support line and moving average cluster could open the door for a deeper correction toward the $100,000 psychological level.
Mixed Momentum Indicators
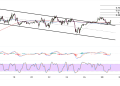
The momentum oscillators are painting a nuanced picture that aligns with the consolidation theme. The stochastic oscillator appears to be cycling between oversold and overbought conditions within the triangle pattern, reflecting the back-and-forth nature of the current price action. Recent readings suggest the oscillator is approaching neutral territory, which often precedes significant directional moves.
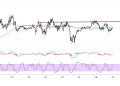
The MACD histogram shows converging momentum, with the signal lines appearing to flatten near the zero line. This convergence typically indicates diminishing momentum in the current trend and often serves as a precursor to volatility expansion.
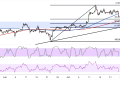
From a broader perspective, Bitcoin’s ability to maintain support above the $105,000 area demonstrates underlying strength in the market structure. The triangle consolidation can be viewed as a healthy pause in the longer-term uptrend, allowing the cryptocurrency to digest previous gains while building energy for the next significant move.
Bitcoin appears to be holding out as financial markets struggle with a fresh round of global trade uncertainty, which has been spurred by threats of additional US tariffs followed by an extension of the trade negotiations deadline. Further tensions in trade talks could trigger a risk-off environment that could turn out bearish for risk assets like crypto while positive developments could reignite risk appetite and allow BTC rallies to gain traction.
