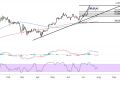
Bitcoin has been trading within a descending triangle pattern over the past month, with price action contained between the $103,000 support level and the resistance line that has been capping rallies since the May highs.
The cryptocurrency appears to be gathering momentum for a potential breakout, though the direction remains uncertain as technical indicators show mixed signals. The descending trend line around the $108K barrier for now continues to act as a formidable barrier, having rejected multiple attempts at higher prices throughout June.
Currently trading around $105,250, Bitcoin sits near the middle of its recent range, suggesting that neither buyers nor sellers have gained decisive control. A convincing break above this resistance could target the psychological $110,000 level, while failure to do so might see price retreat toward the $103,000 support zone.

Neutral Bitcoin Momentum
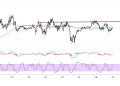
The moving average configuration presents a relatively neutral picture for Bitcoin’s near-term outlook. The 100-period moving average (red line) appears to be converging with the 200-period moving average (blue line), suggesting that the longer-term bullish momentum that characterized Bitcoin’s earlier rally may be waning.
This convergence often precedes significant directional moves, making the current consolidation phase particularly important for determining the next major trend. Also, price action has been oscillating around both moving averages, indicating that Bitcoin is in a state of equilibrium between buyers and sellers.
The lack of a clear moving average crossover suggests that traders should wait for additional confirmation before committing to a directional bias. Should the 100 SMA cross definitively above the 200 SMA with accompanying volume, it would reinforce the bullish case for higher prices.
Cautious Optimism
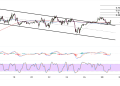
The stochastic oscillator has moved into oversold territory and appears to be curling higher, which typically signals that selling pressure may be exhausting itself. This development could attract bargain hunters looking to capitalize on the recent pullback from higher levels. However, the momentum shift is still in its early stages, and confirmation through sustained upward movement would strengthen the bullish argument.
Meanwhile, the MACD histogram shows signs of potential bullish divergence, with the recent price lows not being confirmed by corresponding lows in the momentum indicator. This divergence often precedes trend reversals, though traders should exercise caution as false signals are common during consolidation phases. The MACD lines themselves remain relatively flat, reflecting the sideways price action that has dominated recent trading sessions.
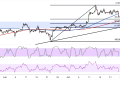
From a fundamental perspective, Bitcoin continues to benefit from institutional adoption and the ongoing development of cryptocurrency infrastructure under supportive regulatory frameworks. However, profit-taking activities and uncertainty around broader market conditions have contributed to the current consolidation phase.
The cryptocurrency’s ability to hold above the $103,000 support level demonstrates underlying strength, while the test of the descending resistance line will likely determine whether Bitcoin can resume its longer-term uptrend or face a deeper correction toward the $100,000 psychological level.
