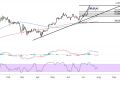
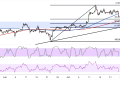
Bitcoin appears to be carving out a compelling inverted head and shoulders pattern on its hourly chart, with price action currently testing a critical neckline resistance close to the $120,000 level.
This bullish reversal formation could be setting the stage for a significant rally toward new all-time highs if buyers can successfully breach this key technical barrier. The cryptocurrency has been consolidating within a sideways trading range for several weeks, with the current price hovering near $118,184.
The inverted head and shoulders pattern has been developing since mid-July, featuring a well-defined left shoulder around $115,000, a deeper head formation that touched support near $114,500, and a right shoulder that mirrors the left side’s structure around similar price levels.

Bitcoin Technical Structure
The neckline of this bullish pattern sits at nearly $120,000, which coincides with previous resistance zones and represents the most crucial hurdle for Bitcoin’s next leg higher. A decisive break above this level would confirm the pattern completion and could trigger measured move targets extending toward the $125,000-$127,000 range based on the formation’s height.
Moving averages are providing mixed signals at current levels. The 100-period simple moving average (shown in blue) appears to be flattening out around $118,500, acting as immediate support for any near-term pullbacks. Meanwhile, the 200-period SMA (displayed in red) is trending higher from below, suggesting that longer-term momentum remains constructive despite recent sideways price action.
The Fibonacci retracement levels from the recent swing high to low reveal important inflection points. The 50% retracement level aligns closely with current price action around $118,000, while the 61.8% Fibonacci level sits near $119,200, just below the critical neckline resistance. These levels could serve as launching pads for the next bullish impulse if they continue to hold as support.
Potential Breakout Scenario
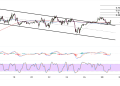
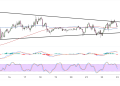
The stochastic oscillator in the lower panel shows promising signs of bullish Bitcoin momentum building. After spending time in oversold territory during the recent consolidation phase, the indicator has turned higher and is approaching the midpoint level around 50. This suggests that selling pressure may be waning and buyers are beginning to regain control.
The MACD histogram, displayed in the middle panel, reveals a gradual improvement in momentum characteristics. The histogram bars have been trending higher from their recent lows, indicating that bearish momentum is losing steam. While the MACD lines haven’t yet generated a bullish crossover signal, the underlying momentum structure appears to be setting up for a potential positive divergence.
Any breakout attempt above the $120,000 neckline would likely require a substantial increase in trading volume to confirm the validity of the move and attract additional momentum players, opening the door for Bitcoin to challenge its previous all-time highs and potentially establish new record levels in the months ahead.
Conversely, a breakdown below this area could invalidate the bullish setup and potentially lead to a retest of the pattern’s head around $114,500.
