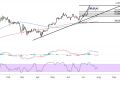
Bitcoin is currently consolidating in a short-term channel formation, with the cryptocurrency trading around $108,062 while mulling a potential break above the near-term top.
If this situation materializes, bitcoin could confirm a bullish flag breakout, which is typically seen as a trend continuation signal. In this case, the cryptocurrency could be poised to bust through the $108K zone and possibly its all-time highs.
Still, it’s worth noting that the $108K to $110K resistance zone has acted as a formidable ceiling, repeatedly rejecting Bitcoin’s attempts to break higher throughout the recent consolidation phase. This pattern typically signals weakening bullish momentum and often resolves with a breakdown below the horizontal support base.
Currently, the range’s lower boundary appears to be holding around the $100,000 psychological level, which coincides with both the 200-period moving average and a significant area of prior resistance turned support.

Moving Average Dynamics
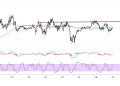
The moving average configuration reveals a nuanced technical picture for Bitcoin, with the 100-period SMA still positioned above the 200-period SMA, indicating that the longer-term bullish structure remains intact for now.
However, the gap between these key averages has been steadily narrowing, suggesting that bearish pressure is building and a potential death cross could materialize if selling accelerates. Price action has been oscillating around both moving averages, with the 100 SMA near $105,000 serving as immediate dynamic resistance and the 200 SMA around $100,000 providing crucial support.
The recent price rejection from the upper triangle boundary has pushed Bitcoin below the 100 SMA, which now represents a key level that bulls must reclaim to prevent further deterioration. A sustained break below the 200 SMA would likely trigger more aggressive selling and could target the next major support zone around $95,000.
Oscillator Divergence
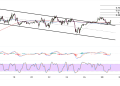
The momentum indicators are painting a mixed but increasingly bearish picture for Bitcoin’s near-term prospects. The stochastic oscillator has been declining from overbought territory and is currently approaching the midpoint level, suggesting that selling pressure could intensify if it continues its descent toward oversold conditions. This downward trajectory in the stochastic aligns with the price weakness observed at the triangle resistance.
Meanwhile, the MACD indicator appears to be forming a bearish divergence pattern, with the histogram showing diminishing bullish momentum even as price attempted to test higher levels within the triangle. The MACD line itself is hovering near the signal line, and a decisive cross below would confirm the shifting momentum dynamics and potentially accelerate the selling pressure.
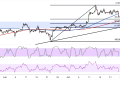
From a broader perspective, Bitcoin’s failure to establish new highs above the December peaks suggests that the market may be entering a corrective phase. However, the proximity to the critical $100,000 support level means that Bitcoin is at an inflection point where either a strong bounce could reinvigorate the bulls, or a breakdown could trigger a more substantial correction toward the $90,000-$95,000 region where stronger buying interest might emerge.
