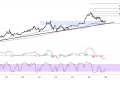
Binance Coin has entered a corrective phase after reaching the $723.4 high, with BNB currently trading at $709.7 as it approaches a highly significant technical confluence zone.
The cryptocurrency appears to be undergoing a healthy pullback that could provide an optimal entry opportunity for traders looking to participate in the continuation of the broader uptrend. The chart displays a robust ascending trend structure that has been guiding BNB higher throughout the extended rally, with multiple trendlines creating a sophisticated support framework.
What makes the current setup particularly compelling is the convergence of multiple technical factors within the blue highlighted area of interest. This zone represents not only a previous consolidation area that could now act as support, but also aligns closely with key Fibonacci retracement levels that often attract institutional buying interest.

Fibonacci Retracement Zone
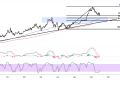
The Fibonacci analysis reveals several critical levels that could serve as springboards for the next leg of Binance Coin’s upward journey. The 38.2% retracement level sits just below current price action, while the more substantial 50% Fibonacci level at $698.7 represents a deeper correction scenario that would still maintain the integrity of the overall bullish structure.
Of particular significance is the 61.8% Fibonacci retracement at $692.9, which creates a compelling confluence with the ascending trendline support. This intersection of mathematical and trend-based support often produces high-probability reversal scenarios, as it represents a level where both systematic and discretionary traders typically converge with buying interest.
The deepest correction scenario would target the 100% Fibonacci level at $674.0, though such a move would likely require a significant shift in market sentiment or external fundamental catalysts. This level coincides with the longer-term ascending trendline, creating an ultimate support zone where the bullish thesis would face its most critical test.
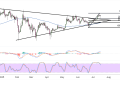
The stochastic oscillator positioning suggests that Binance Coin is working through the corrective process in an orderly fashion, with the indicator currently residing in neutral territory after retreating from overbought conditions. This positioning provides room for either a bounce from current levels or further decline toward the deeper Fibonacci support zones without reaching extreme oversold readings.
BNB Consolidation Thesis
The MACD configuration reinforces the view that this correction represents a temporary pause rather than a trend reversal. While the histogram shows some moderation in bullish momentum, the signal lines remain in constructive territory, suggesting that the underlying trend dynamics have not been compromised. This behavior is typical of healthy corrections within established uptrends.
Moving average dynamics continue to favor the bulls, with the shorter-term averages maintaining their elevation above longer-term counterparts despite some recent flattening. The gap between these moving averages, while narrowing, has not yet reached levels that would suggest trend exhaustion or reversal.
Volume analysis during this pullback reveals controlled selling pressure without the capitulation characteristics that typically accompany major trend reversals. This measured approach to profit-taking suggests that institutional holders remain confident in Binance Coin’s longer-term prospects and are likely waiting for more attractive accumulation levels within the identified support zones.

